axicon
Interpretation of results - Fractional grading (continuous grading)
How the ISO/IEC standard for barcode print quality has changed
The international standard for barcode print quality does not change very often, so when it does it is useful to know what the changes mean and why they have been made.
The print quality standard for barcodes ensures that barcode verifiers measure certain attributes of a barcode, and then provide an overall grade that can be used by printers, manufacturers and their customers to compare print quality and agree which grade will be acceptable for their scanning operations.
The ISO/IEC approach asks for a barcode to be scanned by a verifier at least ten times through its height, with the results of these ten or more different scans being averaged to get a final grade.
The latest change to the print quality standard for linear barcodes, ISO/IEC 15416 is dated 2016, and it updates the earlier version which was published in 2000.
The major change is that the grading of parameters is now to be given to one decimal place rather than integer values. Some barcodes that have failed will now receive a passing grade with the 2016 version of ISO/IEC 15416. The pass grades for GS1 symbols remain unchanged. For all symbols except ITF-14 barcodes with an x-dimension equal to or greater than 0.635 mm (a magnification of 62.5%), the pass grade is 1.5 or C. For ITF-14s with an x-dimension of 0.635 mm or above (typically printed directly onto brown board) the pass grade is 0.5 or D.
First of all, here is brief recap of how linear symbols are graded, using both the 2000 and 2016 approaches.
The verifier scans the barcode and captures a scan reflectance profile (SRP). The verifier then uses the information from the SRP to grade seven different parameters. Three of these are pass or fail parameters, or 4.0 or 0.0 in ISO/IEC terms. The other four parameters are measured in percentages, and these percentages are turned into grades.
With the 2000 version of ISO/IEC 15416, the grades are only ever integer values: 4, 3, 2, 1 or 0 depending upon into which band of values they fall.
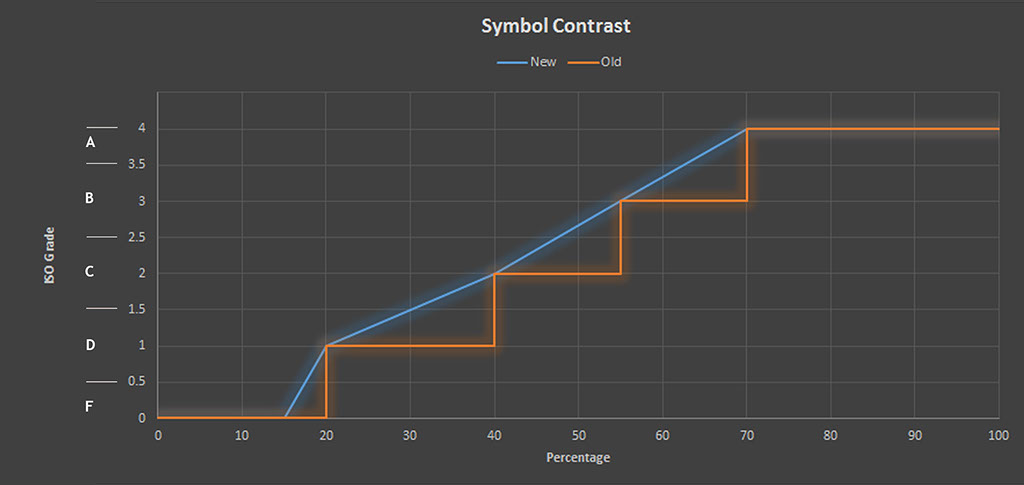
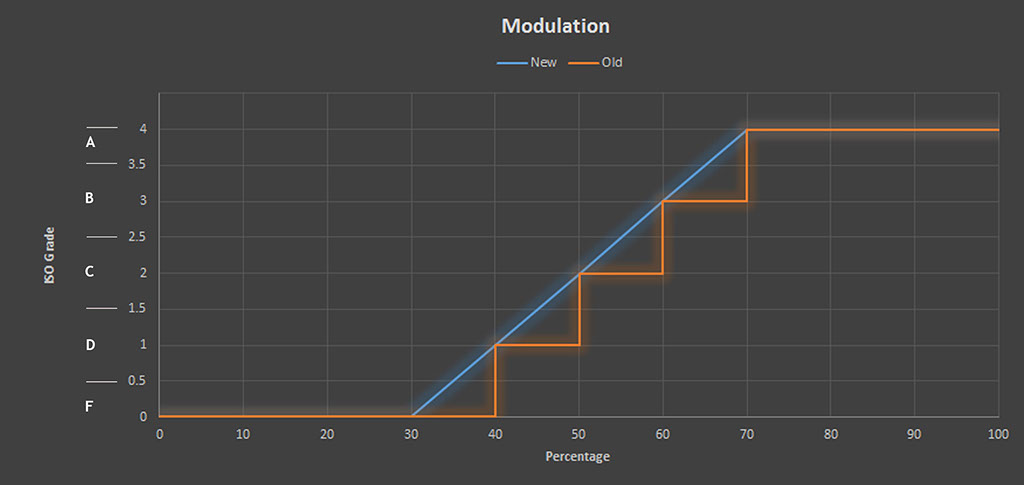
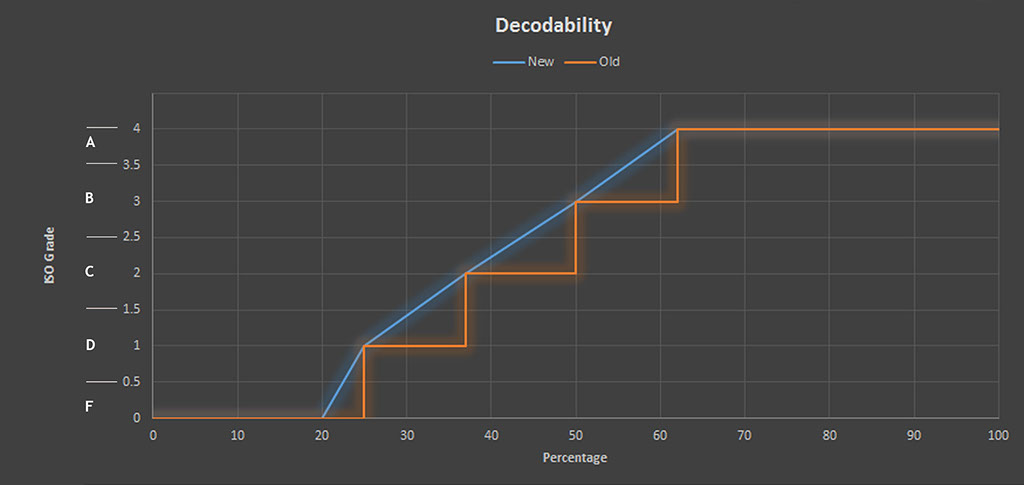
The 2016 version of the standard recognises that a symbol like this should have a better grade than an otherwise similar symbol where the symbol contrast value was consistently, say, 55% to 57%. So now the conversion of percentages to grade values is now done with 41 bands rather than only 5, and this means that barcodes will generally have slightly better grades than they did before. It means that small changes in parameter values at the transition points between grades will not cause such a large change in the grade.
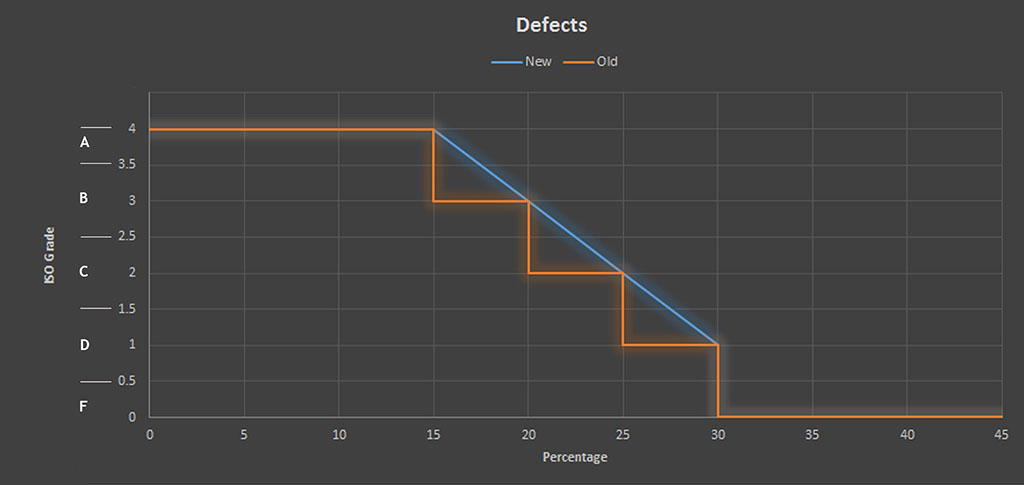
The new version of the standard has also introduced a new way of measuring defects – the white marks that sometimes appear in dark bars, and dark marks that affect the background. It has been recognised that the original method for calculating the defect value and grade was unfairly stringent if the defect was located near to the edge of a bar/space transition and was only a minor defect. A revised method of calculating defect values has therefore been developed for the new version of the standard that is intended to be a more realistic indicator of the significance of the defect to the anticipated scanning performance of the barcode.
There is also a new parameter, which is ungraded, named ‘reflectance margin’. This is a measure of how close the reflectance value of the darkest space or palest bar is to the global threshold, expressed in terms of the symbol contrast. When this parameter’s value is less than 5% it is likely that the barcode is close to failing on decode.
The reporting of the final grade of a barcode is unchanged, so it will still appear in the form n.n/aa/www, where ‘n.n’ is the numeric grade, ‘aa’ the aperture reference, and ‘www’ the wavelength of light used measured in nanometres. Letter grades may still be used, but they are less precise. For example a grade would be stated as 3.4/660/06 or B/660/06. The grade is not given to two decimal places.
The last three parameters that must be graded are unchanged, as they are pass or fail. Minimum edge contrast must be greater than or equal to 15%, the minimum reflectance must be less than or equal to half of the maximum reflectance, and the symbol must be able to be decoded.
Here is the table that shows how the 2016 release of the standard converts the parameter percentages into grades. These percentages are rounded to the nearest integer.
The last three parameters in this table are unchanged, as they are pass or fail. The symbol must be able to be decoded, the minimum reflectance must be less than or equal to half of the maximum reflectance, and the minimum edge contrast must be greater than or equal to 15%.
This table shows how percentages for the different parameters were changed into integer values following the 2000 approach.
This approach has meant that a symbol that has, say, consistent symbol contrast values of 67% to 69% [with all other parameters being 4) would have ten grades of 3 to be averaged, so an overall score of 3.0.
The four graphs below show how particular integer percentage values for the different parameters are converted into grades to one decimal place.
| Grade | Symbol contrast | Modulation | Decodability | Defects | Decode | Minimum reflectance | Minimum edge contrast |
|---|---|---|---|---|---|---|---|
| 4 | ≥ 70% | ≥ 70% | ≥ 62% | ≤ 15% | Pass | ≤ RMax/2 | ≥ 15% |
| 3 | ≥ 55% | ≥ 60% | ≥ 50% | ≤ 20% | |||
| 2 | ≥ 40% | ≥ 50% | ≥ 37% | ≤ 25% | |||
| 1 | ≥ 20% | ≥ 40% | ≥ 25% | ≤ 30% | |||
| 0 | < 20% | < 40% | < 25% | > 30% | Fail | > RMax/2 | < 15% |
| Grade | Symbol contrast | Modulation | Decodability | Defects | Decode | Rmax/Rmin | Minimum edge contrast |
|---|---|---|---|---|---|---|---|
| 4.0 | ≥ 70% | ≥ 70% | ≥ 62% | ≤ 15% | Pass | ≥ 2 | ≥ 15% |
| 3.0 to 3.9 | 55% to 69% | 60% to 69% | 50% to 61% | 16% to 20% | |||
| 2.0 to 2.9 | 39% to 54% | 50% to 59% | 37% to 49% | 21% to 29% | |||
| 1.0 to 1.9 | 20% to 38% | 40% to 49% | 25% to 36% | 26% to 30% | |||
| 0.1 to 0.9 | 15% to 19% | 30% to 39% | 20% to 24% | N/A | |||
| 0.0 | < 15% | < 30% | < 20% | > 30% | Fail | < 2 | < 15% |

Axicon Auto ID es líder mundial en verificación de códigos de barras. Fabricamos y desarrollamos nuestra propia gama de verificadores desde 1989. Los verificadores de códigos de barras Axicon se utilizan para medir la calidad de códigos de barras lineales y matriciales, en todos los niveles de packaging de productos
© 2024 Axicon Auto ID Limited
Mantengase en contacto con nosotros


